Skip to content
Canvaz X

Service

Dashboards and data

See what is happening, today.

The problem

Your numbers arrive in a spreadsheet at month end. By then the problem is old. Different teams quote different figures.

What you get

What is in the box when we are done.

  • One agreed set of key numbers
  • Data pulled automatically from your systems and devices
  • Live dashboards for web and mobile
  • Alerts by email, SMS or push when something drifts
  • PDF and scheduled reports
  • Role-based access so people see what they need

How it works

The steps, in order.

  1. Step 1: Agree the numbers

    Which few figures matter, and how they are calculated.

  2. Step 2: Connect the data

    APIs, databases, devices.

  3. Step 3: Design the views

    Simple first. Detail on click.

  4. Step 4: Add alerts

    Thresholds you control.

  5. Step 5: Review

    We refine after a month of real use.

Related work

Projects that involved Dashboards and data.

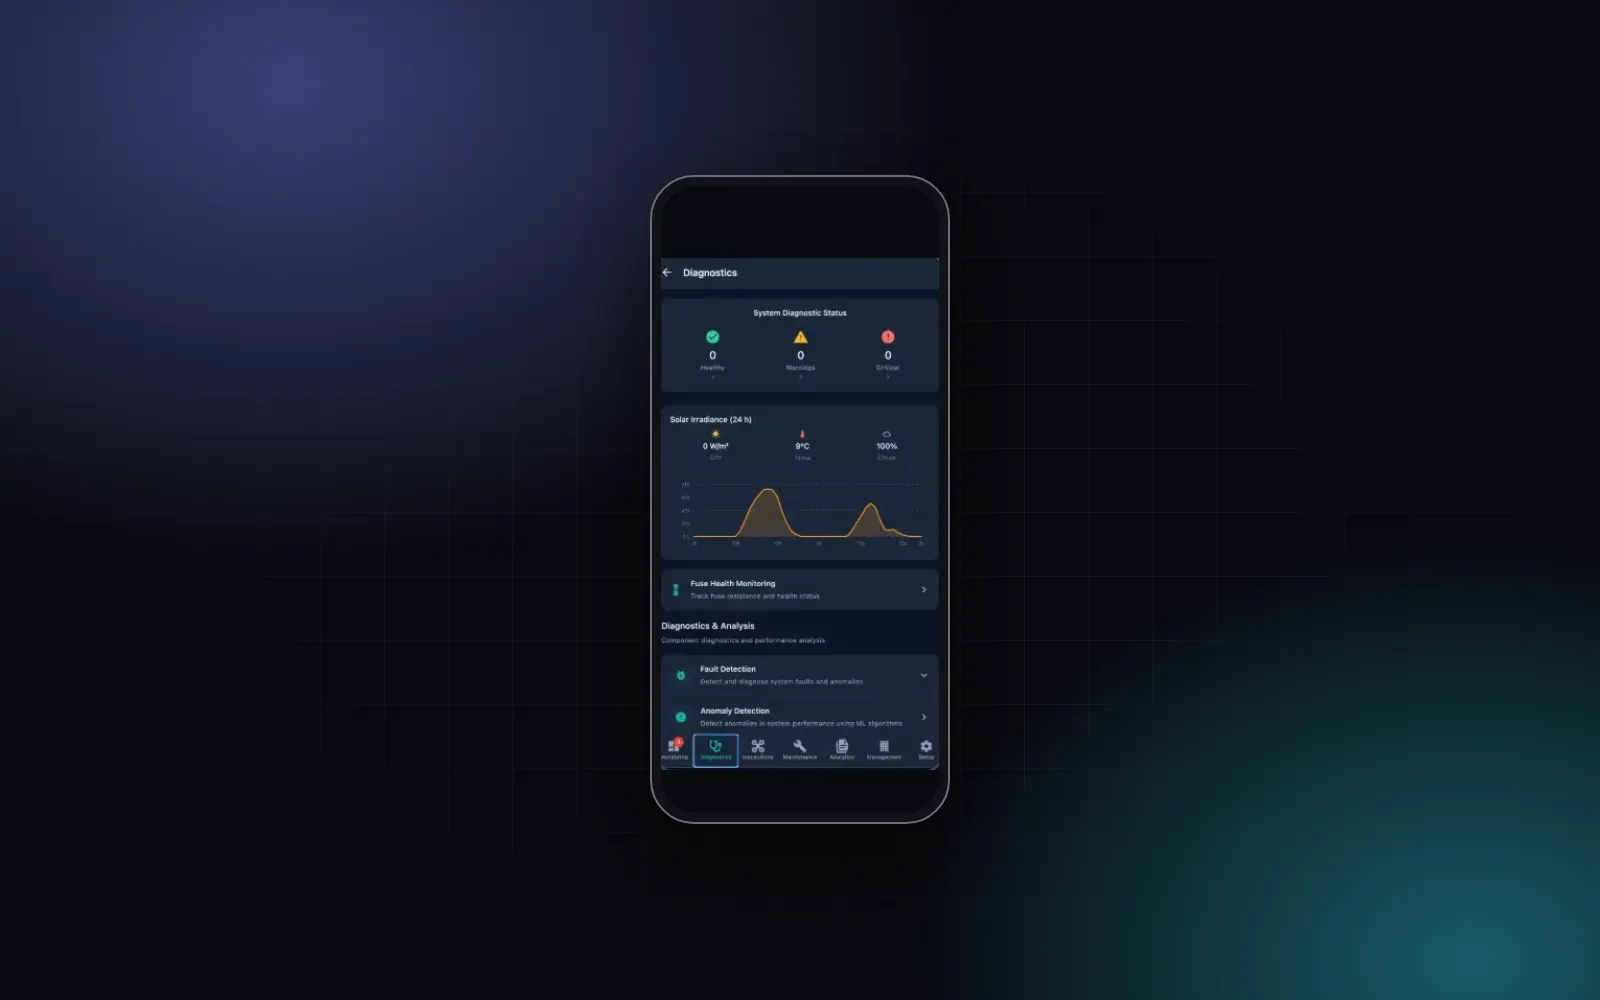
  • The AI4Solar mobile app's diagnostics screen on a phone: system diagnostic status counters, a 24-hour solar irradiance chart, and entries for fuse health, fault detection and anomaly detection.

    AI4SolarRenewable energy

    AI4Solar

    Solar plant monitoring that reads inverters, drone images and satellite data, finds faults early and turns them into alerts and maintenance tasks.

    • AI integration
    • Dashboards and data
    • Custom software
    • E-commerce and payments
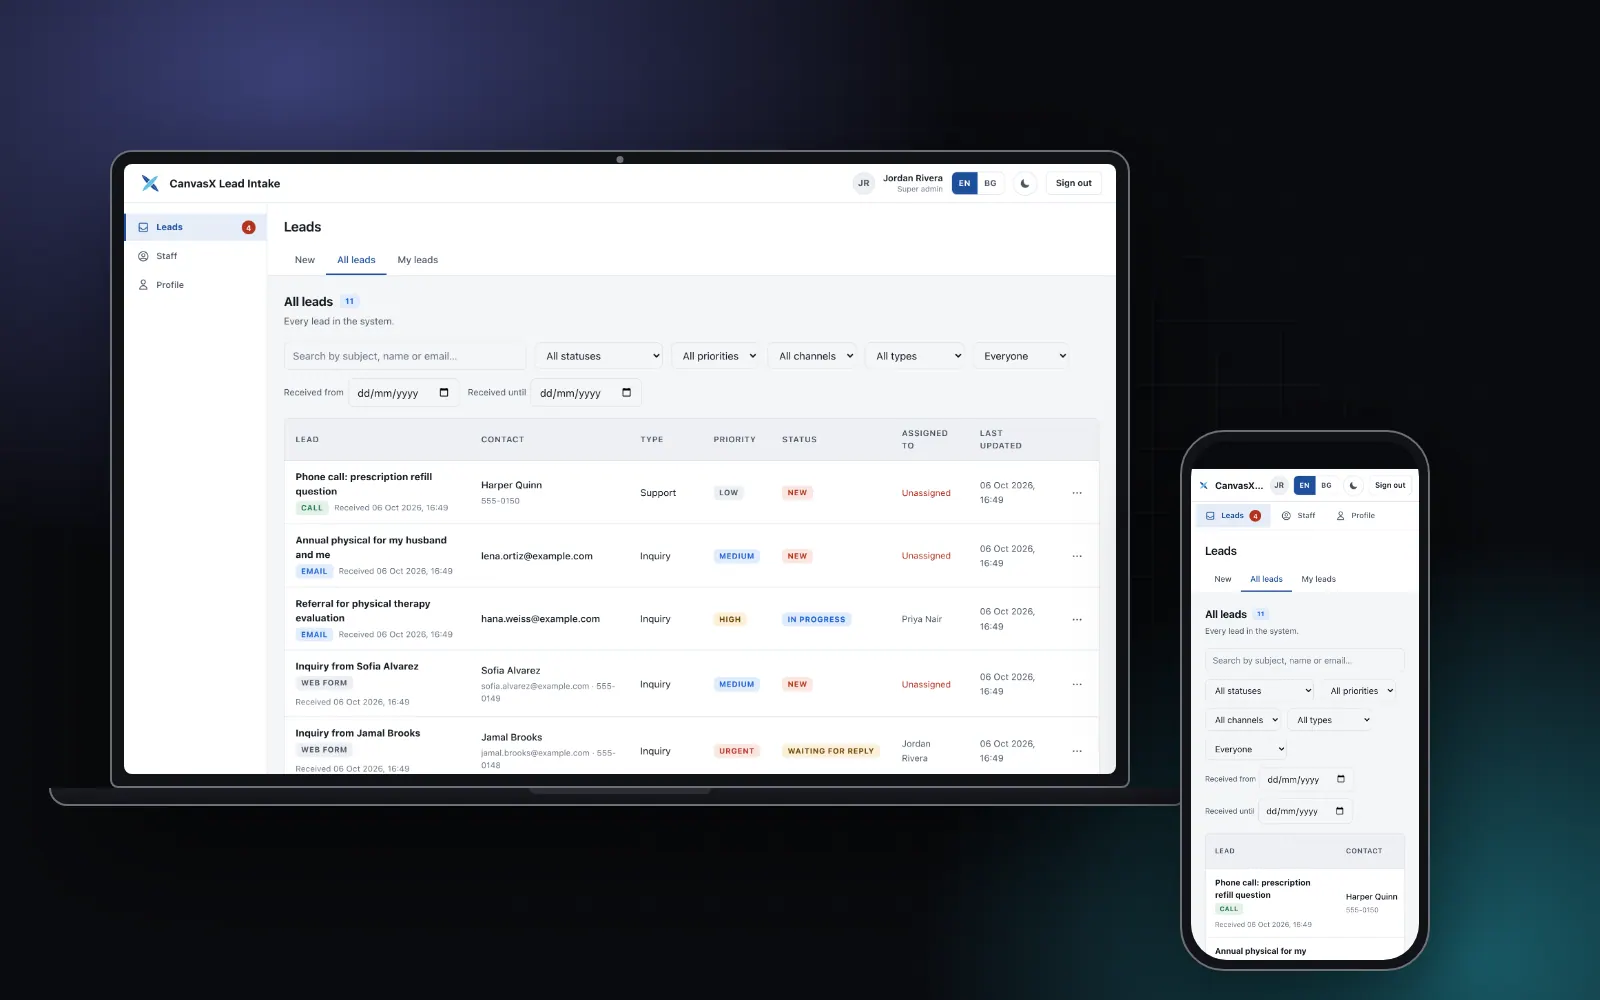
  • CanvasX Lead Intake on a laptop and a phone: the all-leads queue with a filter bar and a table of demo leads showing channel, type, priority and status.

    Medical centersHealthcare

    CanvasX Lead Intake

    Every patient enquiry read in one shared queue, with automatic replies and meeting scheduling. Used by medical centers in the United States.

    • Custom software
    • Business automation
    • AI integration
    • Dashboards and data

See all Dashboards and data work

Tech stack

What we build it with.

  • React with Chart.js and Recharts
  • PostgreSQL
  • Node.js and WebSockets
  • Python for forecasting
  • Expo for mobile dashboards

Questions we hear

Can you use our existing data?

Yes. We connect to your databases, tools and devices.

Why not just use a BI tool?

Sometimes that is right. We build custom when the dashboard needs to trigger actions or live inside your product.

Will it work on phones?

Yes.

How fresh is the data?

As fresh as the source allows, from seconds to daily.

Who can see what?

You set roles and permissions.

Talk to us about Dashboards and data.

Tell us what you need. We will say plainly whether we can help and what we would do first.

Start a project